A
Data centers & power
Screen land against grid access, fiber, water, natural hazards, permitting, and local development signals.

Korzy gives AI agents current, traceable context for the physical world. Connect your factor model, run it across every site in America, and get decisions grounded in parcels, infrastructure, power, ownership, and environmental constraints.
Physical-world decisions have traditionally required opening files one by one: searching portals, reading PDFs, reconciling maps, and rebuilding the same context for every site.
Korzy runs your factor model across every site in America, applying the same factors, weights, and constraints at national scale to accelerate site selection and development.
Korzy currently maintains the most accurate map of utility-scale power in the United States, giving every screen a current view of the infrastructure that determines whether a site can move forward.
Ask in plain language. Korzy builds a geospatial plan, runs it against versioned source data, and returns the answer plus the evidence behind it.
Find industrial parcels over 10 acres within two miles of high-voltage transmission, outside the 100-year floodplain.
I can outline how to screen for these sites, but I do not have access to a current national parcel, transmission, or flood dataset. You would need to check county GIS portals, utility maps, and FEMA records for each location.
No site list. No sources. No observation dates.
Find industrial parcels over 10 acres within two miles of high-voltage transmission, outside the 100-year floodplain.
127 candidate sites match the screen. Each result meets the parcel, grid proximity, and flood exposure requirements.
Clickable sources, observation dates, and confidence attached.
Move from a thesis to a ranked, explainable set of opportunities without spending weeks stitching together the map first.
Screen land against grid access, fiber, water, natural hazards, permitting, and local development signals.
Surface underused land with the right zoning, access, labor shed, utilities, and redevelopment potential.
Understand ownership, improvements, restrictions, environmental exposure, and nearby infrastructure in one view.
Track permits, construction, logistics, and asset changes before they appear in conventional market datasets.
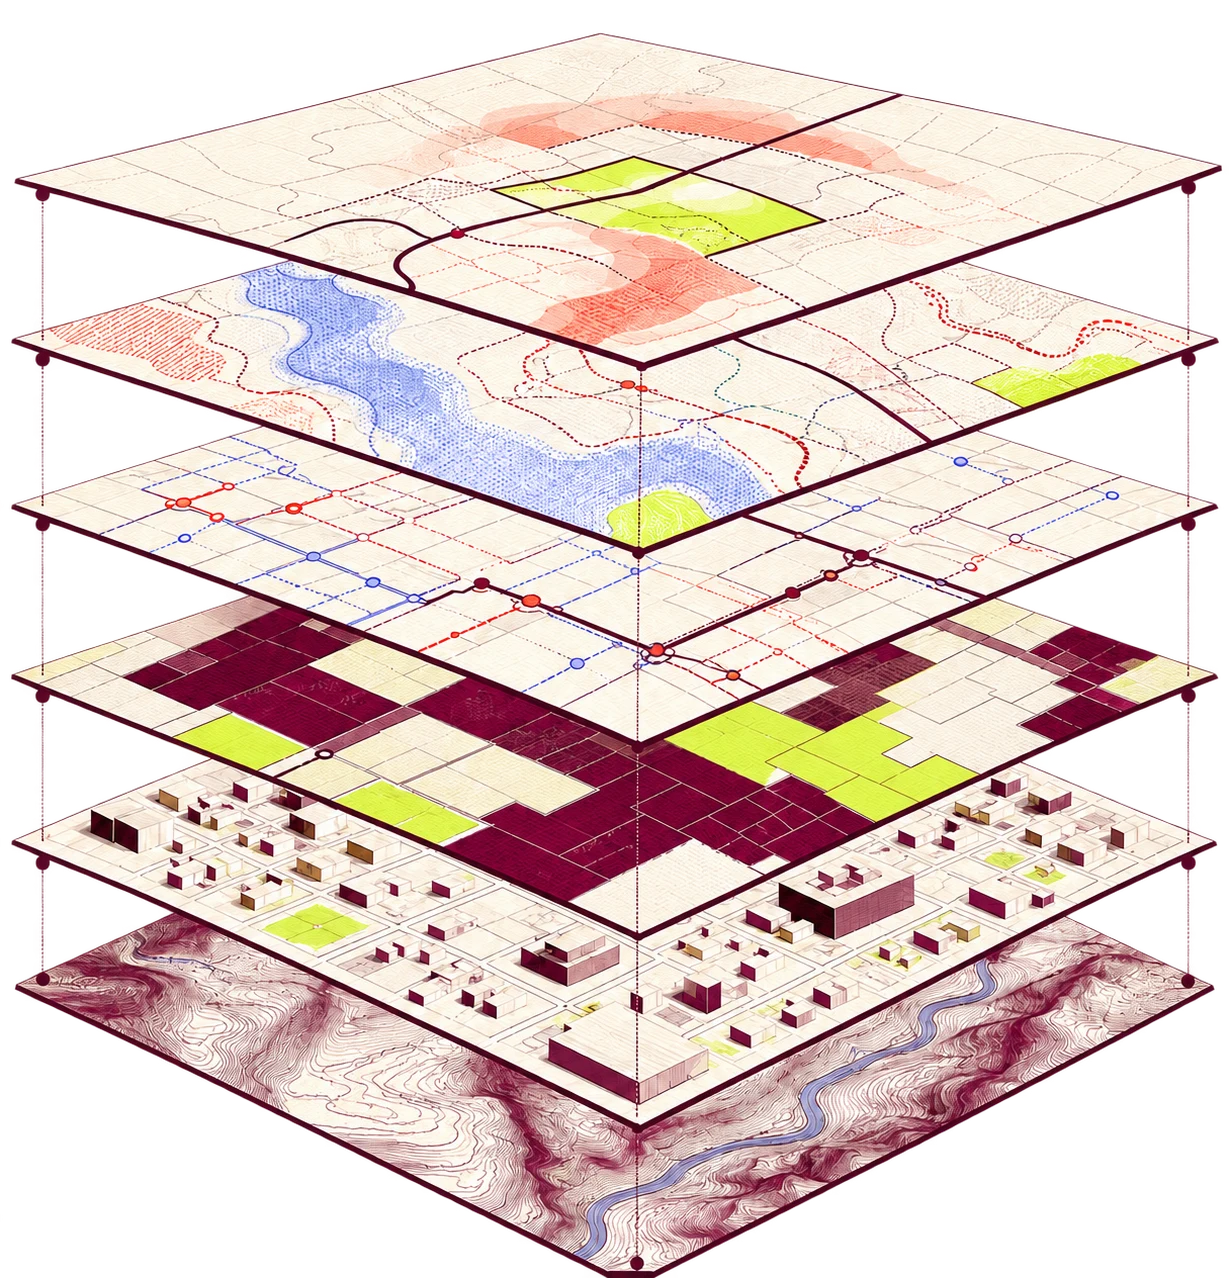
Korzy keeps the original evidence, normalizes it into a common geospatial model, and records when every fact was observed.
Physical graphRaw inputs and provenance remain attached to every derived fact.
Valid time and ingestion time distinguish the world from our observation of it.
Coverage, freshness, and transformation quality are explicit, not hidden.
We’re building a decision layer for the physical economy, starting with land, buildings, and the infrastructure that makes them valuable.
Build with us →Tell us what you are trying to find, rank, or understand. We’ll show you what Korzy can see.
Book a walkthrough